


Seeing your GPU at 100% usage while FPS is unexpectedly low does not automatically mean something is wrong.
In many games, 95–100% GPU usage is completely normal. It usually means the graphics card is the main performance limit. The problem is when your frame rate is much lower than it should be for your GPU, resolution and graphics settings.
If that is happening, the most common causes are excessive GPU load, thermal or power throttling, VRAM pressure, driver problems, V-Sync behaviour or another system bottleneck.
A quick first test is to lower the resolution or GPU-heavy settings. If FPS rises noticeably while GPU usage stays close to 100%, your system is most likely simply GPU-bound. If performance remains unusually low, work through the checks below.
If your GPU usage drops during the hitch, or your FPS remains high despite the game feeling choppy, use our PC game stuttering troubleshooter to follow the diagnostic path that better matches your symptoms.
Is 100% GPU Usage Normal?
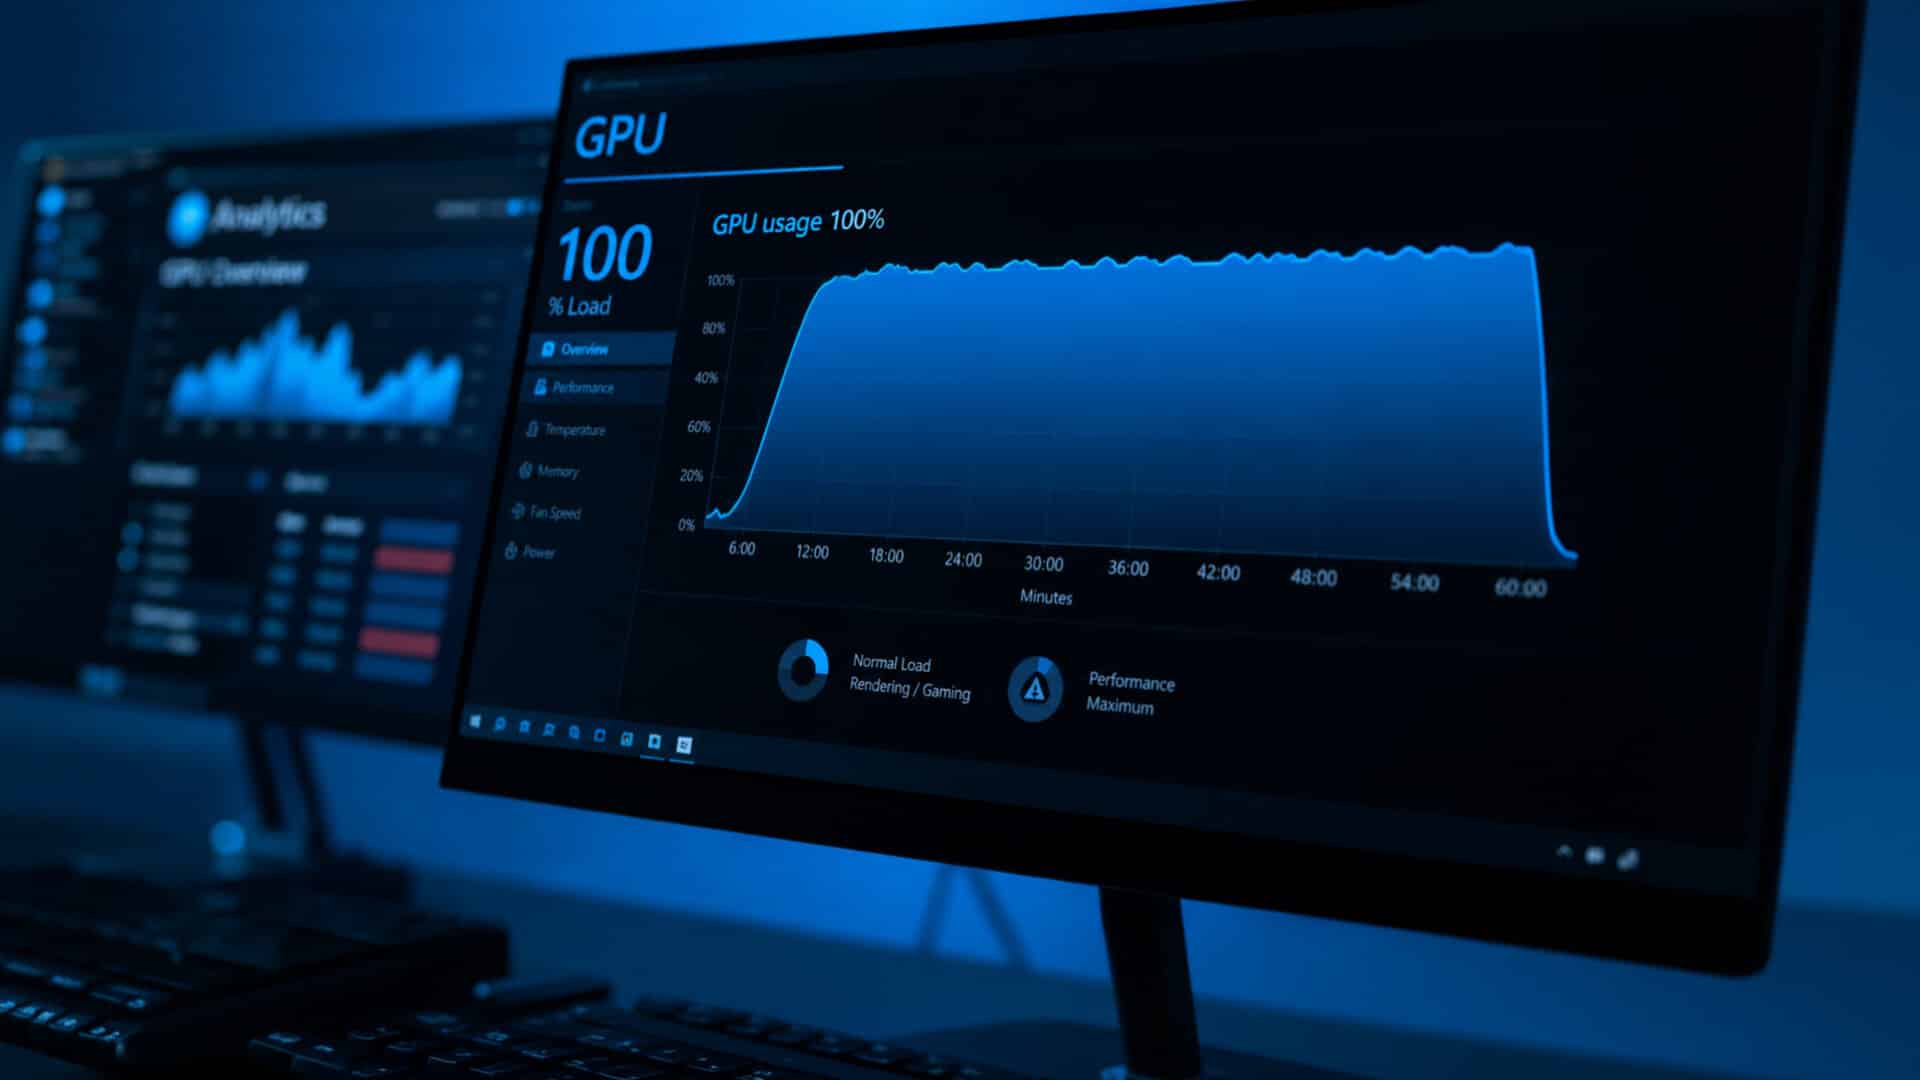
Yes. In a graphically demanding game, high GPU utilization is generally what you want.
If your graphics card is running close to its expected clock speed and power draw while delivering the level of performance expected for your hardware, 100% utilization simply means the GPU is being fully used.
The warning sign is not the utilization percentage itself.
It is 100% GPU usage combined with unexpectedly low FPS, unusually low clock speeds, low power draw, severe stuttering or performance that does not respond normally when graphics settings are reduced.
A visual representation of a GPU at maximum usage
The important thing to remember is:
GPU utilization measures how busy the graphics processor is. It does not tell you, by itself, whether the card is performing correctly.
That is why utilization should always be checked alongside:
- GPU clock speed
- GPU power draw
- temperature and hotspot temperature
- VRAM usage
- CPU per-core utilization
- frame time
- expected performance for your GPU and game
First Check: Are You Simply GPU-Bound?
Before troubleshooting drivers or hardware, perform one simple test.
Reduce the game’s resolution or render scale significantly. For example, switch from 1440p to 1080p, or reduce render resolution to around 70–80%.
Then compare the FPS.
If your frame rate rises substantially while GPU usage remains around 95–100%, the graphics card is behaving normally. The game was simply demanding more GPU performance than your hardware could provide at the previous settings.
You can then improve performance by lowering GPU-heavy settings such as:
- ray tracing
- shadows
- volumetric effects
- reflections
- ambient occlusion
- resolution
- render scale
Upscaling technologies such as DLSS, FSR or XeSS can also reduce GPU workload while maintaining a relatively high output resolution.
If lowering resolution makes little or no difference, continue with the checks below.
Not All “100% GPU Usage” Readings Are Equal
The GPU utilization number you see can vary depending on the monitoring tool and the specific GPU engine being measured.
- Task Manager reports GPU activity through Windows’ WDDM monitoring system and can display activity across different GPU engines.
- MSI Afterburner / RTSS is commonly used for real-time gaming overlays and can display GPU load alongside clocks, temperature and power.
- HWiNFO64 provides more detailed sensor data, including clocks, power, temperatures, memory usage and other GPU metrics.
It is therefore possible for two monitoring tools to show slightly different utilization values at the same moment.
For troubleshooting, avoid relying on the percentage alone. Check the GPU’s clock speed, power draw, temperature and VRAM usage at the same time.
Cause 1: CPU or Game-Engine Bottleneck
A traditional CPU bottleneck usually causes GPU utilization to fall because the processor cannot prepare frames quickly enough to keep the graphics card fully occupied.
However, looking only at total CPU utilization can still be misleading.
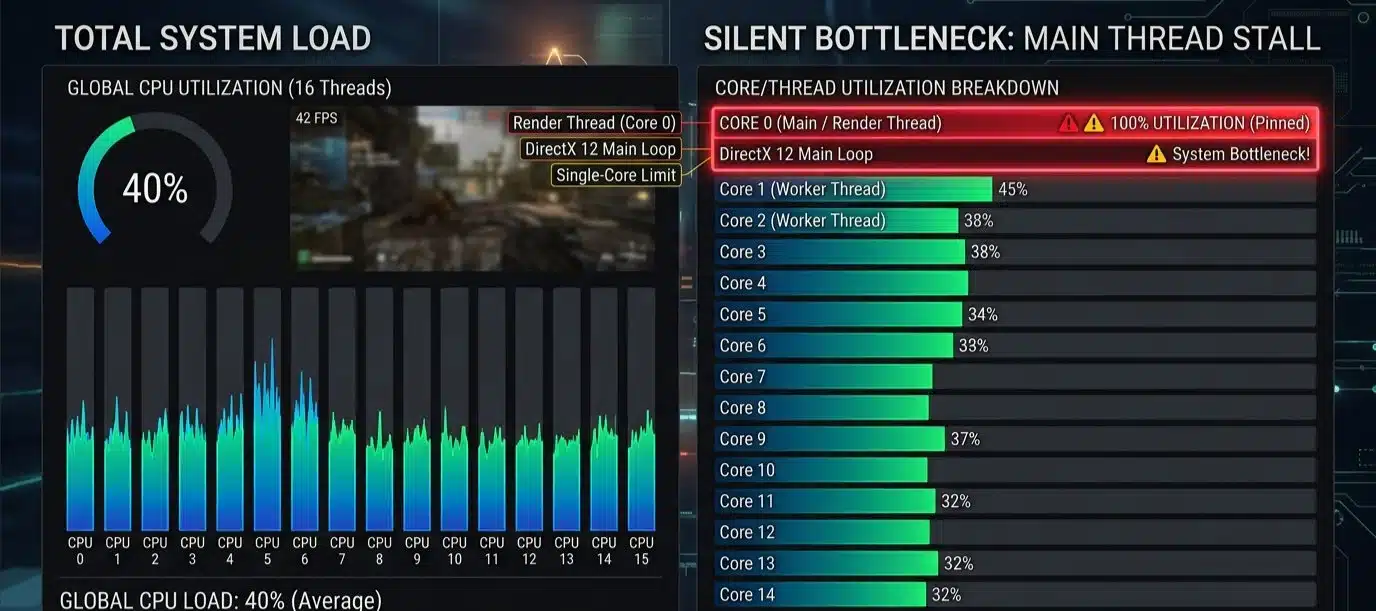
A modern CPU with many cores might show only 30–50% overall usage while one or two important game threads are close to their limit.
Core 0 is completely saturated at 100% while overall CPU load sits at a deceptive 40%
How to Check for a CPU Bottleneck
Monitor individual CPU cores or threads rather than overall CPU usage.
If one important thread is consistently close to 100% while lowering resolution does little to improve FPS, the game may be limited by the CPU or game engine.
You can also test this by lowering CPU-heavy settings such as:
- crowd density
- simulation quality
- view distance
- physics
- object detail
If these settings improve FPS while changing resolution has little effect, the CPU or engine is more likely to be the limiting factor.
What to Do
- Monitor per-core usage: Use Task Manager, HWiNFO or another monitoring tool to check individual logical processors.
- Check RAM configuration: Make sure XMP or EXPO is enabled if supported and that your RAM is running at its intended speed.
- Reduce CPU-heavy settings: Draw distance, simulation quality, crowd density and physics can have a greater impact on the CPU than ordinary texture settings.
- Close unnecessary background applications: Particularly applications consuming significant CPU time while gaming.
Increasing resolution can sometimes shift more of the workload toward the GPU and change frame-time behaviour, but it generally does not increase average FPS in a CPU-limited scenario.
Cause 2: Driver Problems
Driver problems can cause unusually low performance even when monitoring software reports high GPU utilization.
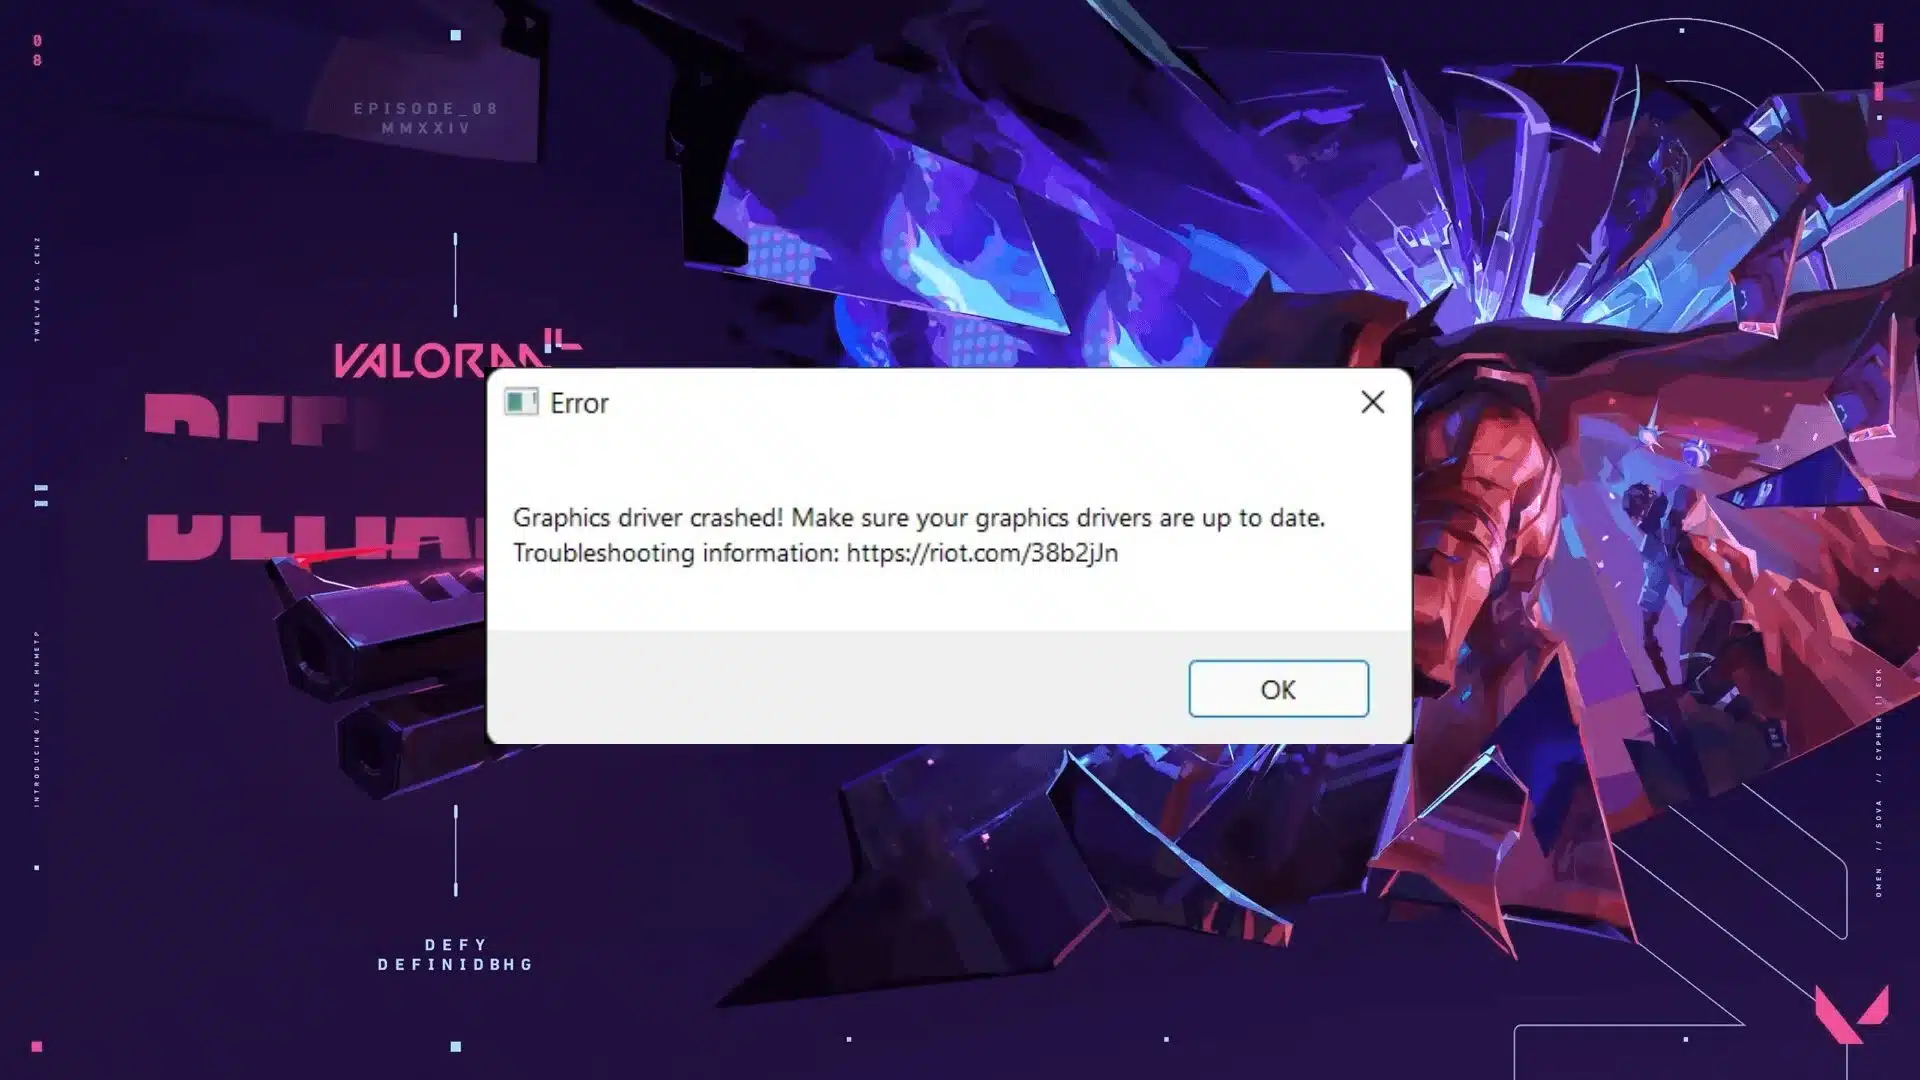
This is particularly worth investigating if the problem started after:
- changing graphics cards
- a major Windows update
- installing a new GPU driver
- moving an existing Windows installation to different hardware
- repeated driver upgrades over a long period
Corrupted or conflicting driver components can interfere with normal GPU performance without necessarily causing a complete crash.
The DDU Protocol
If a normal driver reinstall does not help, a clean driver removal may be worth trying.
- Download Display Driver Uninstaller (DDU), via TechPowerUp.
- Boot Windows into Safe Mode.
- Run DDU to remove the existing NVIDIA, AMD or Intel graphics driver.
- Reboot normally.
- Install the latest appropriate driver directly from the GPU manufacturer’s website.
A clean driver installation is particularly useful when the issue appeared immediately after a GPU replacement or problematic driver update.
Cause 3: V-Sync and Frame-Rate Limits
Synchronization settings can also make low FPS appear more confusing than it really is.
With traditional double-buffered V-Sync, failing to maintain the monitor’s refresh rate can cause the game to fall to a lower synchronized frame-rate step.
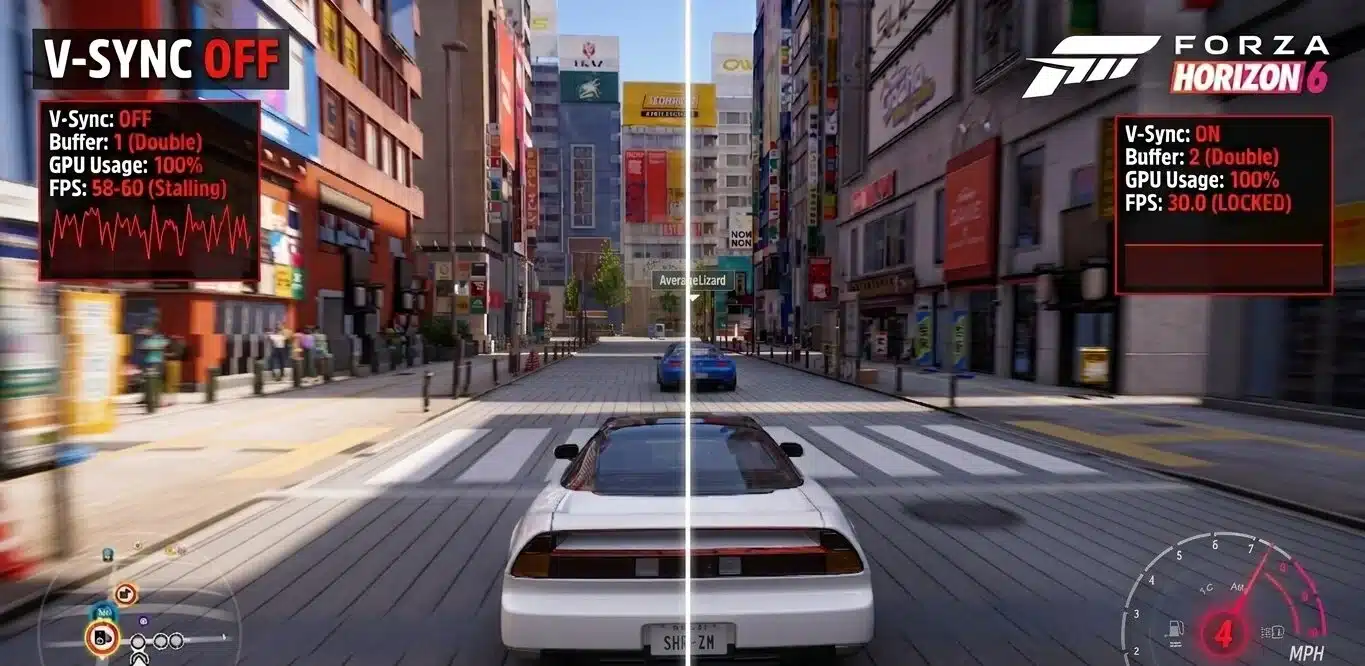
For example, a game targeting 60Hz may fall toward 30 FPS if it cannot consistently maintain 60 FPS under certain double-buffered implementations.
A split-screen comparison showing how a minor frame drop plunges standard double-buffered V-Sync down to a hard-locked 30 FPS.
What to Check
Temporarily disable V-Sync and any frame-rate cap and see whether performance changes.
If you use a G-Sync or FreeSync display, configuration depends on your display, GPU and preferred setup. A common approach is to remain within the monitor’s variable-refresh range and use a frame cap slightly below the maximum refresh rate.
The important diagnostic step is to temporarily remove synchronization and frame-rate limits so you can determine whether they are responsible for the apparent FPS ceiling.
Cause 4: Thermal or Power Throttling
A GPU can report very high utilization while performing badly if its clock speed has fallen significantly.
This can happen because of:
- excessive GPU temperature
- high hotspot temperature
- power limits
- insufficient power delivery
- laptop power-management restrictions
- aggressive thermal throttling
For example, a GPU running at 100% utilization but only a fraction of its expected boost clock will deliver much less performance than the same card running at its normal frequency.
How to Spot It
Monitor:
- GPU core temperature
- hotspot temperature
- GPU clock speed
- memory clock speed
- board power draw
- performance-limit indicators, if supported
Do not diagnose thermal throttling from GPU temperature alone.
The more useful clue is whether temperatures rise while clock speed falls substantially below the card’s normal operating range.
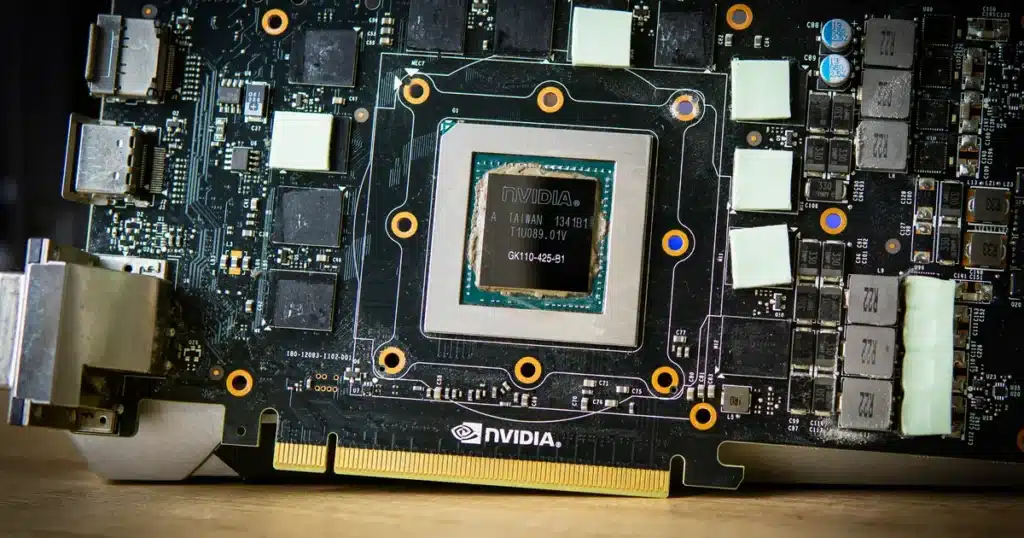
Degraded thermal pads on surrounding VRAM modules will cause localized thermal throttling under heavy memory loads.
What to Do
First:
- clean dust from the cooler
- check that GPU fans are operating properly
- improve case airflow
- verify power connectors
- restore default GPU settings if the card is overclocked
Undervolting can also reduce power consumption and temperature on some GPUs while maintaining similar performance, but it should be done carefully and tested for stability.
If an older graphics card has abnormal temperatures despite good airflow, servicing the cooler may eventually be necessary. If you are trying to decide between buying a used, older flagship that runs hot versus a newer, highly efficient mid-range card, see our head-to-head breakdown of the RTX 4060 vs RTX 3080, where we analyze how generational power draws affect thermal efficiency.
Cause 5: VRAM Bottlenecks
Running out of available VRAM can severely hurt gaming performance.
When a game’s textures and other GPU resources exceed available video memory, data may need to be moved between VRAM and system memory more frequently.
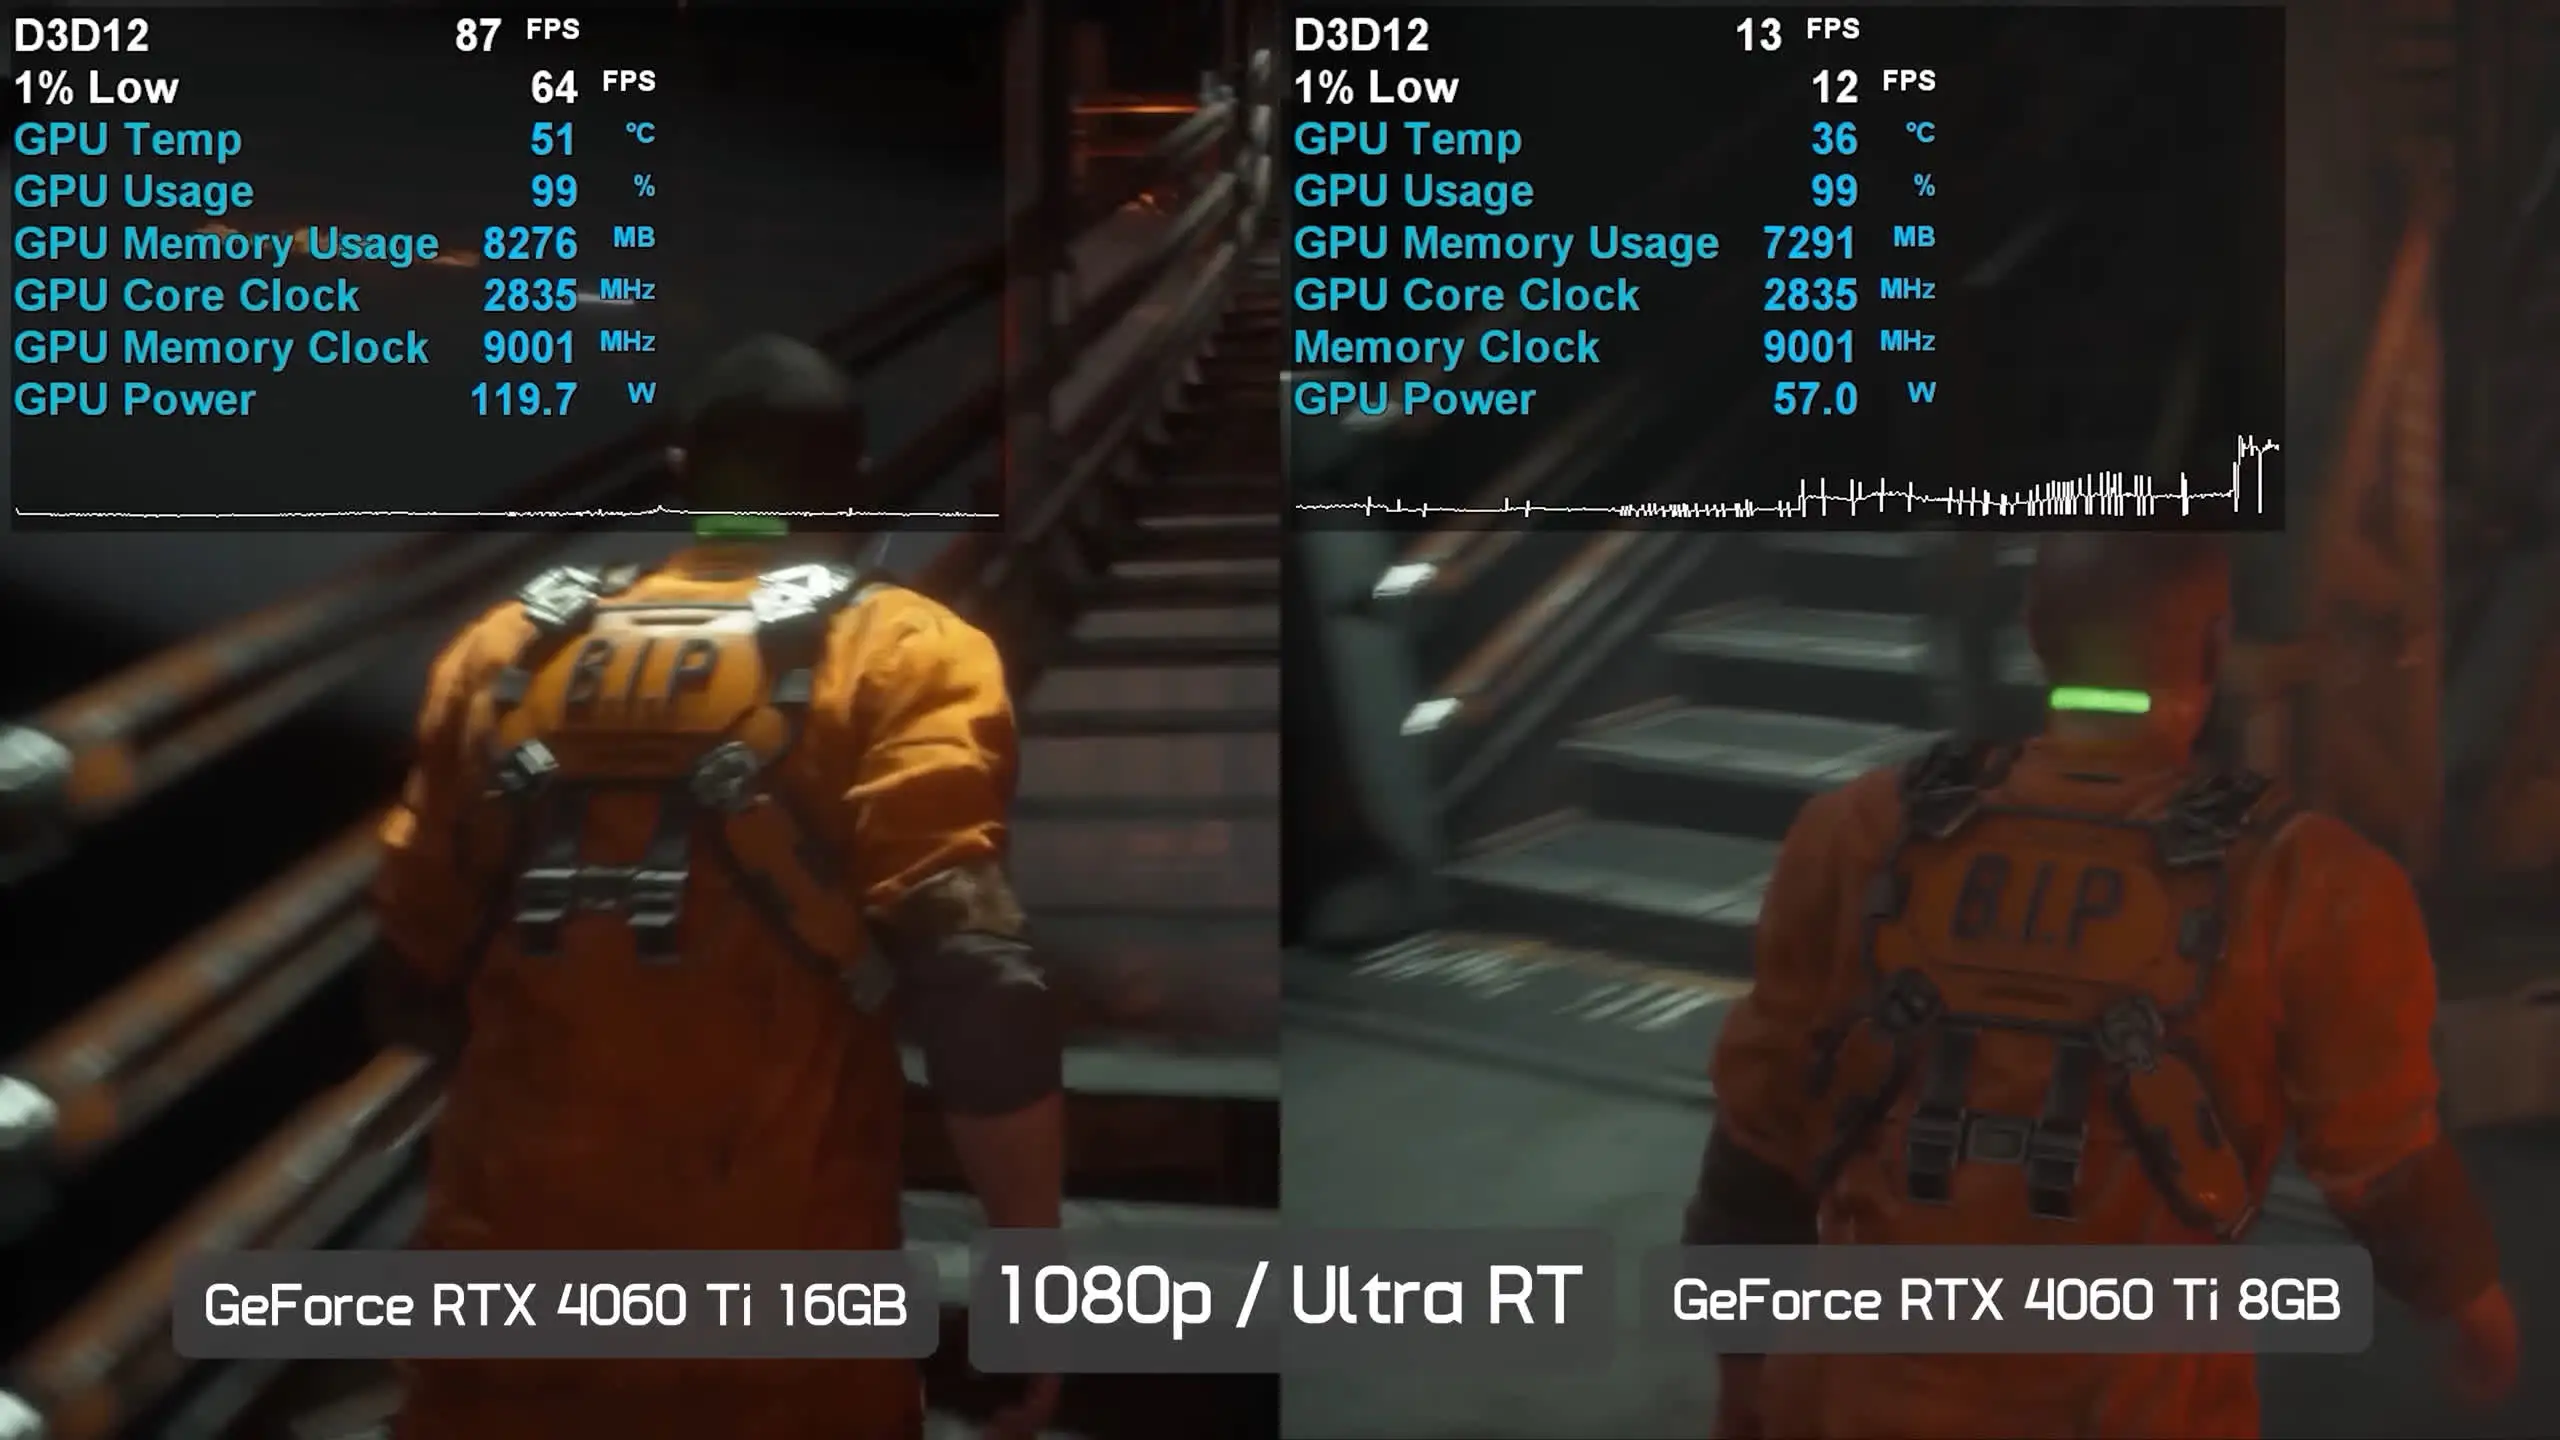
That additional traffic can result in:
- stuttering
- frame-time spikes
- texture pop-in
- severe performance drops
- unusually poor 1% lows
This is particularly common when using very high texture settings, ray tracing or high resolutions on a GPU with limited VRAM.
When VRAM fills up, performance tanks. This highlights a bizarre trend in recent GPU generations where newer cards sometimes pack less memory than their predecessors. We heavily explored this specific architectural bottleneck in our deep dive on the RTX 4060 vs RTX 3060 (12GB), proving why the older card’s 12GB frame buffer sometimes handles heavy texture loads better than a newer 8GB card.
Real-world evidence of VRAM starvation causing an unplayable 13 FPS drop on an 8GB card. (Image: TechSpot)
What to Do
- Lower Texture Quality.
- Reduce ray-tracing settings.
- Lower Render Resolution or enable DLSS/FSR/XeSS.
- Close GPU-accelerated background applications if VRAM usage is already close to the card’s limit.
If you’re considering upgrading your hardware entirely to bypass these memory traps altogether, check out our comprehensive matchup of the latest current-gen contenders, the RTX 5060 Ti vs RX 9060 XT, to see how their updated memory configurations and upscaling tech handle modern gaming workloads.
Cause 6: Power-Limit or Low-Power-State Problems
Power draw is one of the most useful measurements when troubleshooting high GPU usage with unexpectedly low FPS.
A GPU may report high utilization while operating at a much lower clock speed or power level than expected.
For example, if a desktop graphics card that normally consumes around 200–250W under heavy gaming load is stuck far below that while also running at reduced clocks, investigate:
- GPU power connectors
- PSU problems
- laptop power mode
- driver power-management settings
- GPU power limit
- PCIe connection
- firmware or hardware faults
Do not compare power draw blindly against the card’s maximum rated power. Different games place very different loads on a GPU.
Instead, compare clocks and power consumption against known-normal behaviour for your specific card in the same type of workload.
The Diagnostic Checklist
Do not guess. Change one variable at a time and watch what happens.
| Symptom | Likely Area to Investigate | What to Check |
|---|---|---|
| 100% GPU + low FPS + normal/high clocks | Genuine GPU limit or heavy graphics settings | Lower resolution and GPU-heavy settings |
| 100% GPU + low FPS + unusually low clocks | Thermal or power throttling | HWiNFO / GPU-Z sensors |
| Low FPS + little improvement after lowering resolution | CPU or engine bottleneck | Per-core CPU load |
| High VRAM usage + stutters/frame-time spikes | VRAM pressure | VRAM usage and texture settings |
| Problem started after driver update/GPU replacement | Driver issue | Clean driver reinstall |
| FPS appears locked at a specific value | V-Sync/frame cap | Disable synchronization and caps temporarily |
| GPU power draw and clocks are abnormally low | Power-management/hardware issue | Power connectors, clocks, power sensors |
| Low FPS + GPU spikes between high and low usage | Broader system instability or bottleneck | Frame-time graph, CPU, power and driver behaviour |
If your diagnostic tools show high background utilization even when a game isn’t running, specific software features are likely hijacking your render pipeline. Check out our step-by-step guide on how to stop Chrome, Discord, and Game Bar from draining your GPU resources by optimizing their hidden hardware acceleration settings.
What If Nothing Fixes It?
If the basic troubleshooting steps above make no difference, move to hardware isolation before attempting risky firmware changes.
Try:
- restoring the GPU to stock settings
- reseating the graphics card
- reseating GPU power cables
- checking the GPU in another PCIe slot if appropriate
- testing another power supply if available
- checking PCIe link width in GPU-Z
- testing the GPU in another PC, if possible
GPU-Z can show the active PCIe link in the Bus Interface field. Keep in mind that modern GPUs may reduce their PCIe link speed while idle, so use GPU-Z’s render test when checking it.
Firmware flashing should be treated as an advanced last resort.
Do not flash the GPU vBIOS simply because GPU utilization is high and FPS is low. An incorrect BIOS can make the card unusable.
Only investigate firmware if you have strong evidence that the installed firmware is incorrect or corrupted and you know the exact original BIOS required for that specific board model.
100% GPU Usage but Low FPS: FAQ
Is 100% GPU usage bad?
No. High GPU utilization while gaming is usually normal. It becomes worth investigating when FPS is much lower than expected, clocks are abnormally low, temperatures are excessive or performance behaves unusually.
Why is my GPU at 100% but my FPS is only 30?
Your graphics settings may simply be too demanding, but thermal throttling, VRAM pressure, V-Sync behaviour, power limitations or driver issues can also cause unexpectedly low FPS.
Lower your resolution first. If FPS rises significantly, the GPU is probably just the performance bottleneck.
Should GPU usage be 100% while gaming?
In GPU-heavy games, yes. Utilization in the 95–100% range generally means the graphics card is being fully used.
Why do I have low FPS even though my GPU is fully utilized?
Full utilization only tells you that the GPU is busy. You also need to check clock speed, temperatures, power draw, VRAM usage and whether performance improves when graphics load is reduced.
Can VRAM cause 100% GPU usage and low FPS?
VRAM pressure can cause major performance loss, especially through stuttering and poor frame times. Lowering textures, resolution or ray tracing can help determine whether memory capacity is contributing to the problem.
Can overheating cause 100% GPU usage with low FPS?
Yes. If excessive temperature causes the GPU to reduce its clock speed, the card can remain heavily utilized while delivering much lower performance.
Conclusion
If your GPU is running at 100% while FPS is low, do not assume the graphics card is failing.
Start with the simplest test: lower the resolution.
If FPS rises immediately, the system is most likely GPU-bound and you need to reduce graphics load or use upscaling.
If FPS remains unusually low, check the GPU’s clock speed, temperature, power draw and VRAM usage, then investigate CPU limitations, drivers, synchronization settings and power delivery.
The key is to remember that GPU utilization measures activity, while FPS measures output. You need both — along with clocks, temperature and power — to understand what the graphics card is actually doing.
