


Microsoft Vice President Scott Hanselman has introduced gputaskman, a free, open-source GPU monitoring utility that shows which applications are consuming graphics memory and GPU resources. The experimental tool provides process-level VRAM measurements, GPU activity monitoring, and detailed information about local AI workloads, offering PC users another way to investigate graphics memory usage.
Available through Hanselman’s public GitHub repository, gputaskman supports NVIDIA and AMD GPUs on Windows, with additional functionality for Linux, Windows Subsystem for Linux (WSL), and Apple Silicon Macs. The project is distributed under the MIT license and includes downloadable portable Windows builds.
Unlike conventional GPU monitoring utilities that primarily display overall memory consumption and hardware utilization, gputaskman focuses on identifying individual processes responsible for GPU activity. Its terminal-based interface displays dedicated graphics memory usage, GPU-accessible system RAM, and graphics engine activity, helping users distinguish between applications actively using the GPU and processes occupying graphics memory.
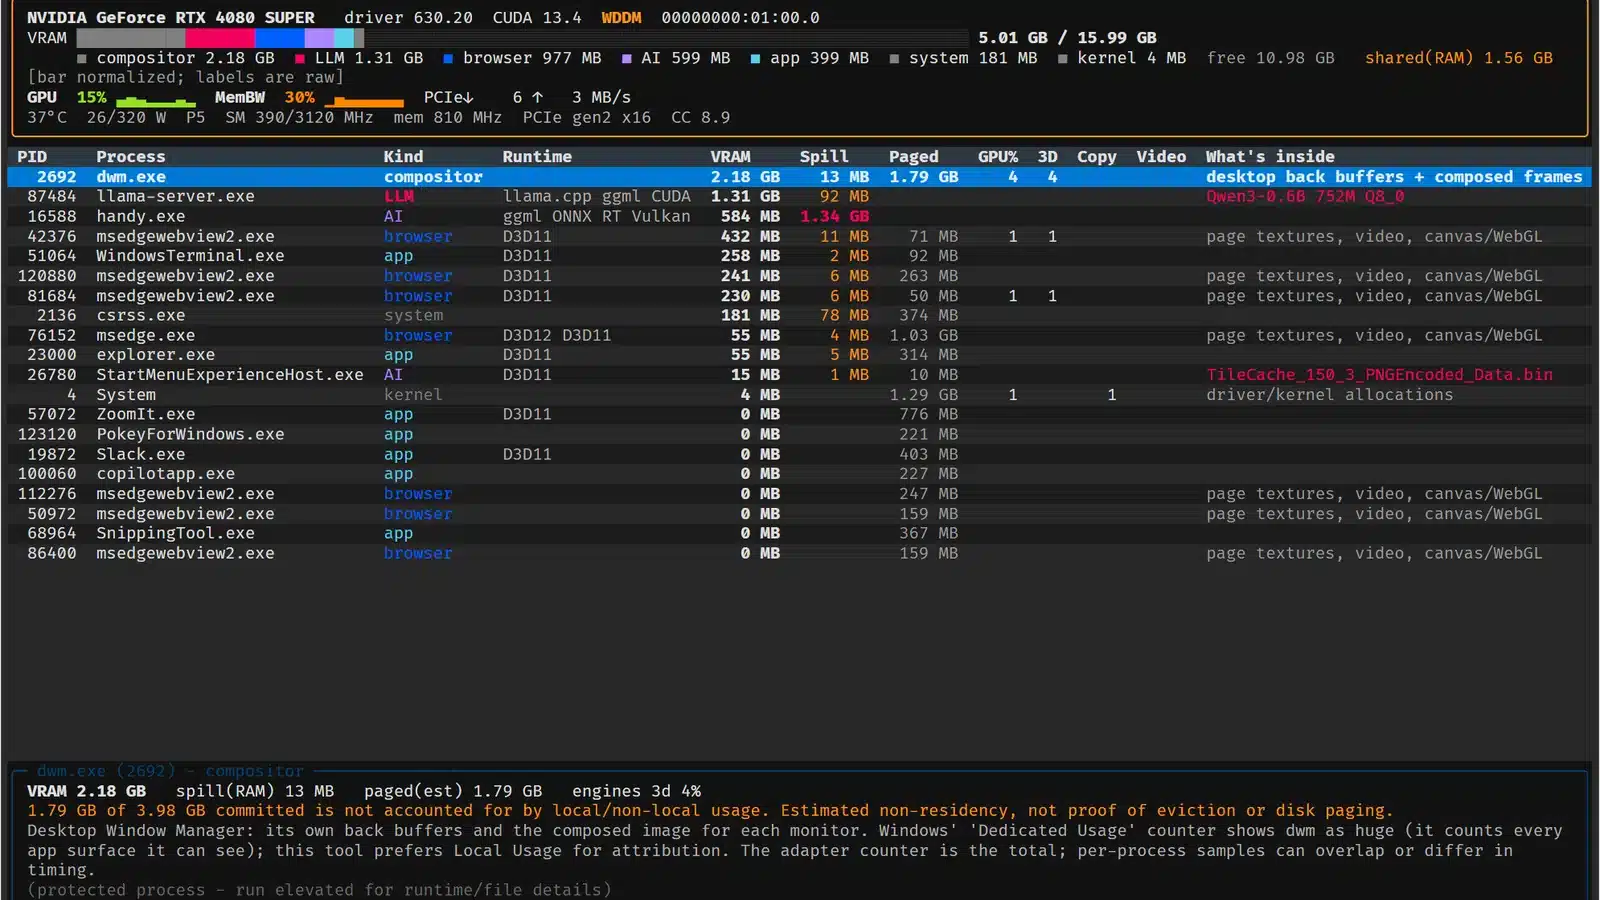
The utility can identify GPU resources consumed by games, web browsers, desktop applications, and background processes. For PC gamers, this information could help investigate unexpected VRAM consumption when running demanding games alongside other applications, particularly on graphics cards with limited memory capacity.
Windows Task Manager already provides some per-process GPU information, including dedicated GPU memory usage through its Details tab. However, gputaskman brings additional measurements and process diagnostics into a dedicated interface, including information about GPU runtimes and memory allocation categories.
The tool also displays hardware measurements such as GPU utilization, temperature, power consumption, clock speeds, PCIe activity, and memory activity where supported. Available readings depend on the graphics card, operating system, and driver.
One of gputaskman’s more specialized features is its ability to inspect local AI workloads. The utility can identify supported language models and display information about model architecture, quantization, layer counts, estimated model weight sizes, and key-value cache memory requirements.
Support includes integrations and detection mechanisms for runtimes and applications such as llama.cpp, Ollama, LM Studio, and certain GGUF-based models. These features can help users determine how much graphics memory is being occupied by local AI applications alongside other GPU workloads.
This functionality is particularly relevant as consumer GPUs increasingly handle both gaming and local AI applications. NVIDIA hardware, for example, can run graphics workloads alongside CUDA-based AI processing, making detailed resource monitoring useful when investigating memory pressure.
The growing importance of GPU resource management is also reflected in NVIDIA's newer GPU resource controls for RTX Spark laptops, which address resource allocation across gaming and AI workloads.
On Windows, gputaskman supports 64-bit Windows 10 and Windows 11 systems equipped with supported NVIDIA or AMD graphics hardware and current WDDM drivers. Portable builds are available for traditional x64 PCs and native Windows ARM64 devices.
Users can extract the appropriate ZIP archive and launch the executable through Windows Terminal or PowerShell without installing Python or the CUDA Toolkit. The application also supports single-snapshot reporting and JSON output, allowing GPU measurements to be collected for further analysis.
Linux support includes NVIDIA GPU monitoring through NVML, while the project’s documentation also describes AMD support on native Linux. WSL functionality can obtain additional information from Windows host GPU counters, although per-process measurements differ from those available on a native Windows installation. Apple Silicon macOS support is also available with platform-specific limitations.
Hanselman explicitly describes gputaskman as early experimental software. Although device counters and process memory measurements are collected from system interfaces, some workload classifications and AI memory breakdowns rely on estimates or indirect evidence.
The developer also cautions that the tool cannot inspect individual game textures or provide a complete breakdown of every allocation inside a game’s VRAM. Detecting a runtime or model file does not necessarily prove that a particular AI model is actively executing on the GPU.
Hardware compatibility and measurement availability remain areas of ongoing development, with improvements to multi-GPU support, model identification, and platform-specific monitoring listed among the project’s future priorities.
For users investigating GPU memory consumption, gputaskman provides a more specialized view of individual processes than the standard Windows monitoring interface. Its open-source implementation also allows developers to inspect the code and contribute improvements as hardware support expands.
